Dashboard Sars-Cov-2
This is a simple dashboard tracker for new covid cases identified in Jalisco, Mexico. The chart contains the following time-series:
- Historical confirmed cases.
ma_short: 7-day moving averagema_long: 21-day moving average
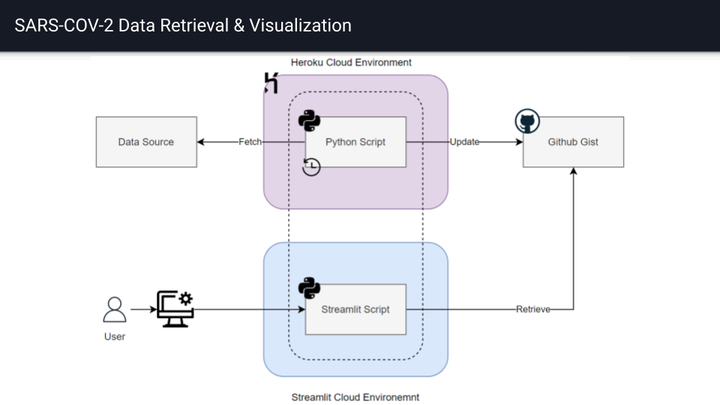
This project consists of two parts: data-retrieval, data-visualization.
A python module called
sars_cov_2_mx was developed to share common abstractions among the two parts.
Data Retrieval:
- The raw data is retrieved from an official mexican source.
- A python process is executed in a cloud environment (Heroku) to download the latest data available an update a Github Gist.
Data Visualization: